


Everything You Need To Know
my blog
Visualizing Insights: Unveiling Data's Stories with Python
What Is A Data Visualization?
Data visualization is the process of creating graphs, diagrams, tables, or similar visual elements to present data. The purpose of data visualization is to facilitate the understanding of a dataset. Micro, small, and medium enterprises (MSMEs), abbreviated as UMKM in Indonesian, are a common term in the economic world and are owned by individuals or individual business entities. Data visualization of MSMEs in Banda Aceh aims to help many people understand the changes in MSMEs in the city.
The visualization of MSME (Micro, Small, and Medium Enterprises) data in Banda Aceh city is done using the Python programming language with matplotlib and JSON. Matplotlib is a Python library software that focuses on visualizing data such as graphs, charts, etc. JSON is a text-based file format commonly used in data interchange processes.
Data of Micro, Small, and Medium Enterprises (MSMEs) in Banda Aceh city
Banda Aceh, the capital city of Aceh province in Indonesia, is home to a vibrant and diverse community of Micro, Small, and Medium Enterprises (MSMEs). These businesses range from traditional crafts to modern startups, showcasing the region's unique culture and fostering economic growth. With strong government support and strategic initiatives, MSMEs contribute significantly to job creation and overall prosperity, making them integral to the city's development. Their resilience and adaptability in the face of challenges further reinforce their importance in driving Banda Aceh's sustainable progress
                    {
                        "2013": 3613,
                        "2014": 4463,
                        "2015": 6482,
                        "2016": 9591,
                        "2017": 9725,
                        "2018": 9975,
                        "2019": 10690
                    }
Source Code:
                    import matplotlib.pyplot as plt
                    import json
                    from urllib.request import urlopen

                    url = "https://raw.githubusercontent.com/mhmdfadil/API-JSON1/main/DataUMKM_KotaBandaAceh.json"

                    response = urlopen(url)

                    data_json = json.loads(response.read())
                    dict = data_json

                    x = list(dict.keys())
                    y = list(dict.values())

                    print(x, y)

                    plt.xlabel('Tahun')
                    plt.ylabel('Jumlah')
                    plt.plot(x, y)
                    plt.title('Data UMKM Kota Banda Aceh')
                    plt.show()
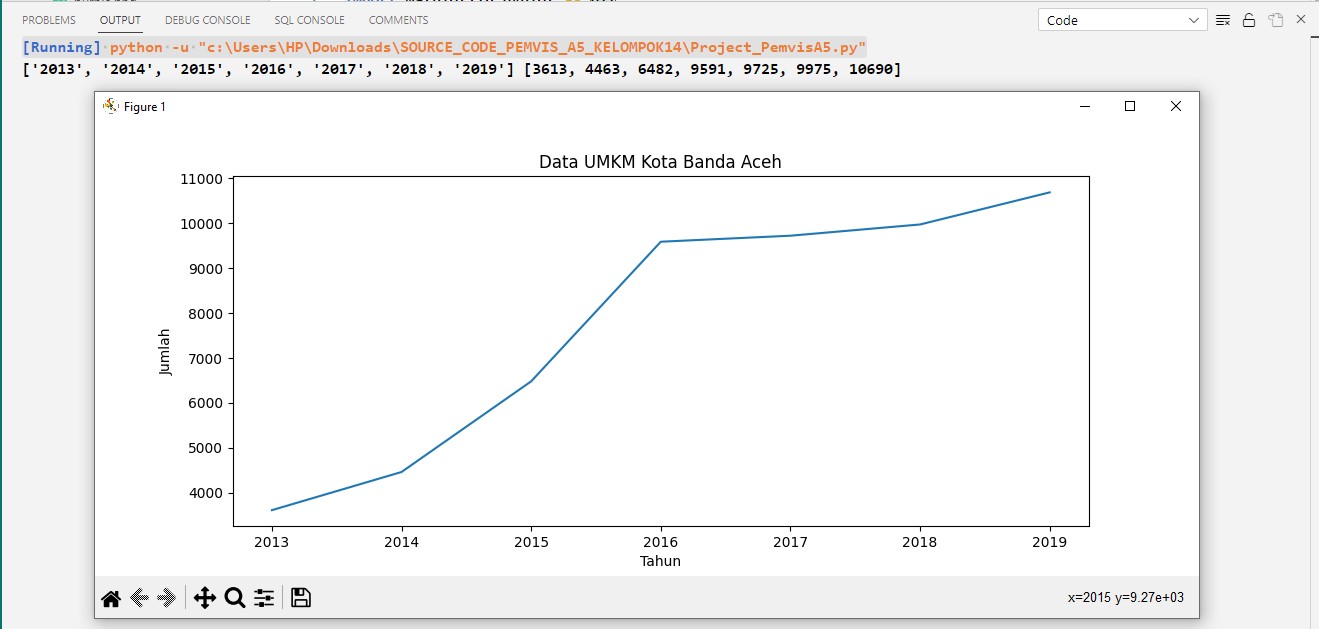
Program Result:
['2013', '2014', '2015', '2016', '2017', '2018', '2019'] [3613, 4463, 6482, 9591, 9725, 9975, 10690]